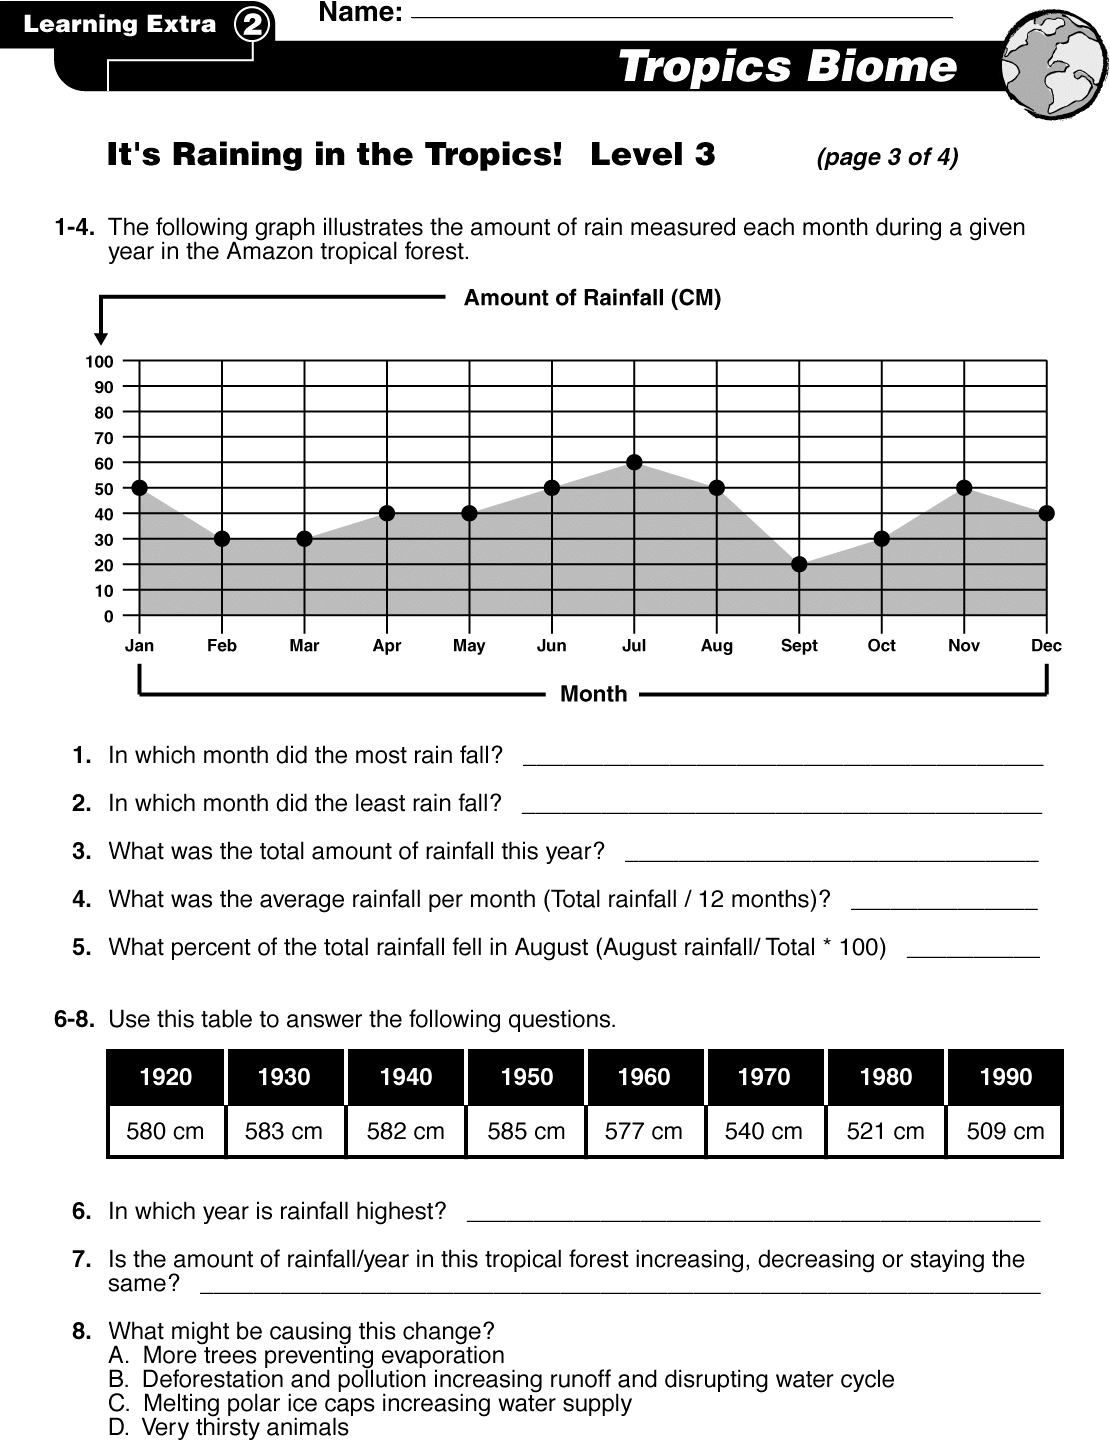
ocr: Learning Extra Name: Tropics Biome It's Raining in the Tropics! Level 3 (page 3 of4) 1-4. The following graph illustrates the amount of rain measured each month during a given year in the Amazon tropical forest. Amount of Rainfall (CM) 100 90 80 70 60 50 40 30 20 10 0 Jan Feb Mar Apr May Jun Jul Aug Sept Oct Nov Dec Month 1. In which month did the most rain fall? 2. In which month did the least rain fall? 3. What was the total amount of rainfall this year? 4. - What was the average rainfall per month (Total rainfall / 12 months)? 5. What percent of the total rainfall fell in August (August rai ...